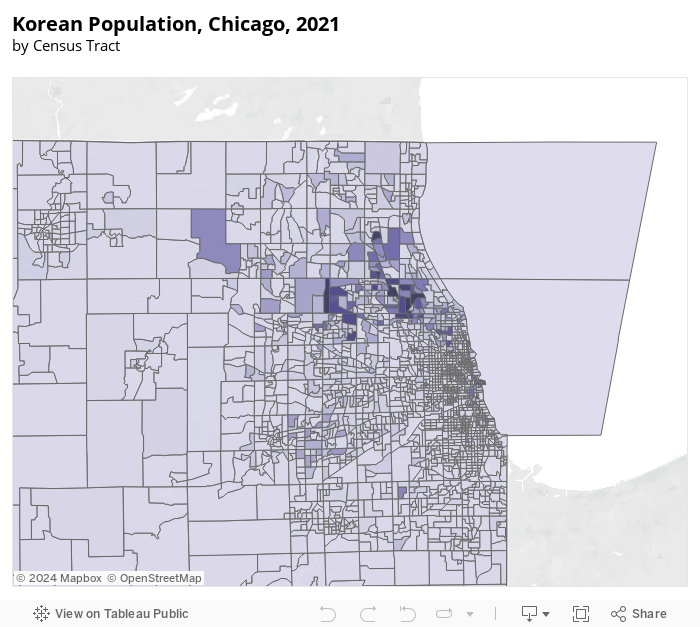
The Chicago metropolitan area is home to 51,317 Koreans, the majority of whom (70%) reside in Cook County and the city of Chicago itself. Albany Park, North Park, and West Ridge are the neighborhoods with the highest concentration of Korean residents.
Demographic Data
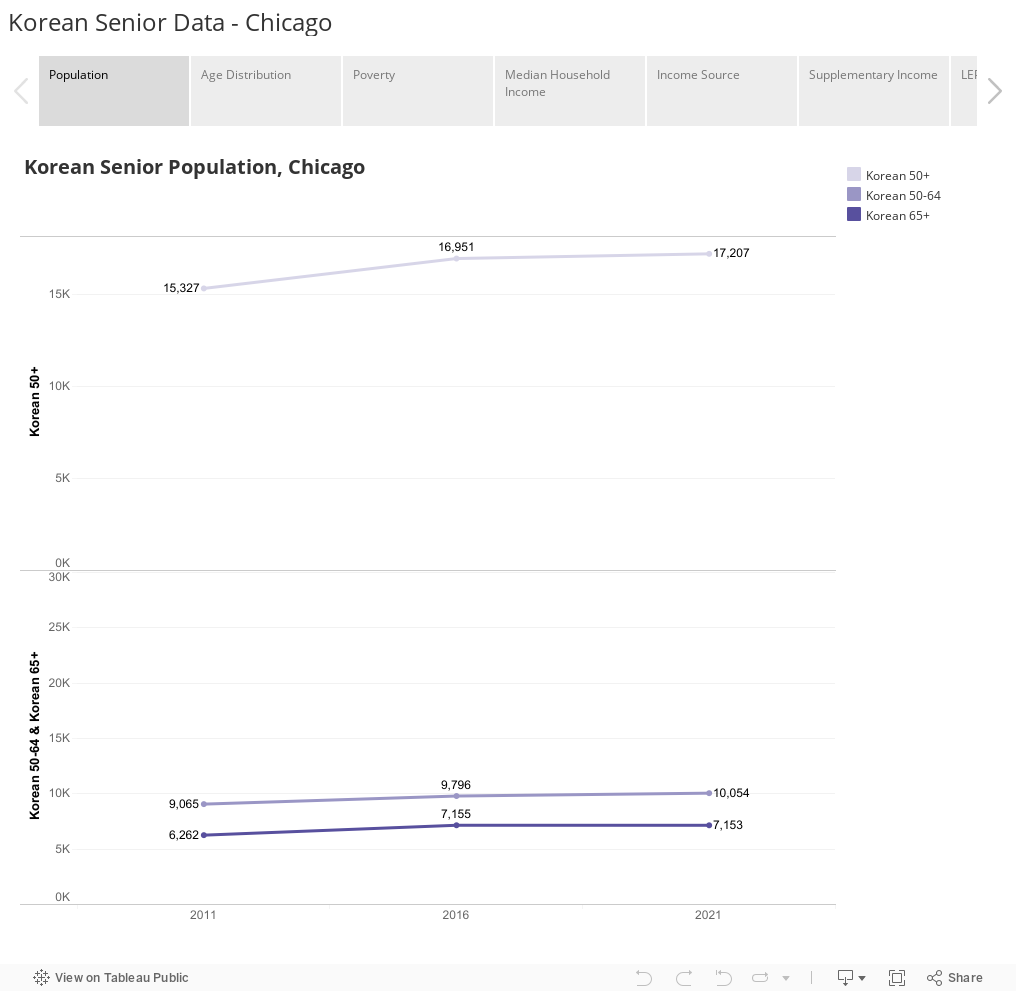
In Chicago, the Korean senior population grew by 10.6% between 2011 and 2016. However, this growth rate slowed down considerably to 1.5% between 2016 and 2021.
Korean seniors in Chicago have higher poverty and near-poverty rates than both the general senior and Asian senior populations. Specifically, for Korean seniors aged 65 and over, the poverty rate (27.2%) is nearly three times higher than that of the general senior population (9.4%) in Chicago.
The median household income of Korean seniors in Chicago was less than that of both the general senior population and the Asian senior population.
Korean senior households in Chicago rely less on retirement funds for their household income compared to the general senior population in the area.
Just 10.6% of Korean senior households receive retirement income, compared to 22.8% for general senior households and 13.2% for Asian senior households in Chicago.
In Chicago, Korean senior households rent more often than general senior and Asian senior households, and they also experience higher rates of rent burden and severe rent burden.
In Chicago, households led by Korean seniors aged 65 and over experience more severe overcrowding compared to households led by general and Asian seniors in the same age group.
Korean seniors in Chicago have more limited access to the internet and smartphones compared to both the general senior and Asian senior populations.
Survey Findings
In Chicago, a total of 100 participants took part in the survey. Among them, 51% fell into the age group of 50-64, while 26% were aged 65-74, 18% were 75-84, and 5% were 85 years or older. The gender distribution was evenly split between female and male participants. Regarding employment status, only 10% of those aged 65 and older were still working, while the majority, comprising 76%, were retired. About half of the participants (52%) relied on Medicare or Medicaid while 39% had private insurance, 5% were uninsured, and 4% had both public and private insurance. Additionally, 28% of the participants did not have a college education, and 16% lacked access to the internet.
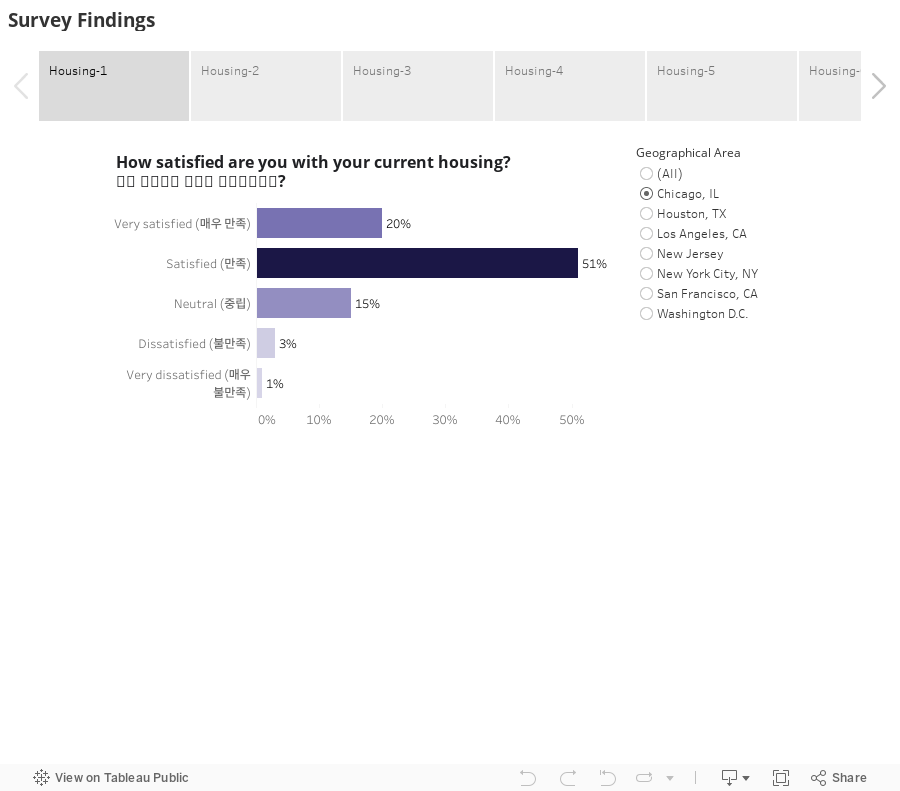
Among the participants, 69% were homeowners with nearly half of them (49%) still having an outstanding mortgage.
About a third of participants (33%) said their homes would need renovation for them to live comfortably as they got older. 21% of these participants identified their bathrooms as the areas in most need of modifications.
Almost half of the participants (48%) have considered living in assisted living facilities, and the most important factors under consideration were the cost and proximity to family.
More than half of the participants (56%) preferred staying in their homes when long-term care was needed while nearly one-fifth (19%) indicated that returning to Korea was ideal for the same purpose.
93% of the survey participants relied on driving as their primary means of transportation. Among them, 50% anticipated continuing to drive into their 80s while 23% had plans to keep driving well into their 90s.
Most participants either didn’t use or were unhappy with public transportation because of the distance to bus or train stations (39%) and safety concerns (23%).
27% of participants said it was at least sometimes physically demanding to get to places outside of their homes.
The majority of participants (87%) turned to their family members for assistance when they needed help. When attempting to find professional caregiving, 39% of participants reported a lack of information as the biggest challenge. Language barriers also posed significant issues for 38% of participants.
A notable 27% of participants rated their health as 5 or lower on a scale ranging from 1 to 10, 1 being the worst health condition. Among the health concerns reported by participants, 43% dealt with cholesterol issues, 36% with hypertension, 27% faced arthritis, and 25% were managing diabetes. Nearly all participants, a striking 98%, had a designated place to go or someone to call in case they fell ill, underlining the availability of support networks. Moreover, 97% of participants had a primary care physician, indicating a strong connection to healthcare providers for their medical needs.
However, 38% of participants mentioned language as a barrier to healthcare access, and 26% cited a lack of information as another hindrance.
Among the participants, 18% indicated that their income did not adequately cover their basic needs. 40% of these participants reported their healthcare needs were not being met and 33% had problems paying rent. Another 25% of all participants considered their income only somewhat sufficient. Of these participants, 28% did not have enough money for food.
Among the participants, 26% experienced feelings of isolation or anxiety at least some of the time. Furthermore, 28% of the participants reported that these feelings had increased since the beginning of the pandemic.
20% of participants did not feel they had access to professional mental health services that address their needs.
49% of participants wanted more active social lives.
Friends and relatives were the primary sources of information about programs and services for 68% of participants. Following closely behind, newspapers were the second most commonly cited source, providing information to 53% of participants. Social media played a role for 41% of the participants, and community magazines and flyers were consulted by 27%.
The participants expressed a strong desire to see more hobby and interest clubs being offered, with 40% of them showing interest in such programs. 21% of participants were also interested in legal assistance programs, and 16% wanted more accessible public transportation services.
Technical Notes
This analysis utilizes data from the 2016 and 2021 American Community Survey 5-year Public Use Microdata Samples, focusing on the “alone” Census category for the Korean population. This means that the term “Korean alone” refers to individuals who identified exclusively as Korean without reporting affiliation with any other ethnic category. Respondents who identified as Korean in addition to another racial group (for instance, Korean and Black) are not included in the “Korean alone” count. In any analysis leveraging Census Bureau data, the “alone” figure should be regarded as the minimum size of the population under consideration.
This report was co-authored by Linying He, Associate Director of Research, and Research Associates, Dena Li and Yuncheng Wang. Special thanks to Meera Venugopal, Director of Communications, Jenny Shin, Senior Communications Coordinator, and Annie Yang, Social Media Coordinator, for their design and editorial input. Illustrations were designed by Michelle Kwon, freelance illustrator and animator. Rushil Shakya, freelance web consultant, contributed to web development.